Sept/Oct
2002 Syllabus changes
The revised syllabus
and/or a version of the original syllabus with the changes marked in it can be
downloaded from the Board of studies web site (www.boardofstudies.nsw.edu.au).
Conquering Chemistry
is still a very close match to the revised syllabus though certain sections and
exercises,
detailed below, can now be omitted. The first of the two sub-sections below is
for students: it tells you what you can omit from CCHSC. The second
sub-section is primarily for teachers: it gives more detail about what the changes are
and how they affect CCHSC.
In both
sub-sections LC, MC and RC mean left, middle and right column respectively
and DP means dot point. The references are to the original syllabus (1999 or
March/April 2001)
1.
For
students
As a
result of these syllabus changes you should omit or change the following:
|
In
Chapter 13
| · |
Omit Test for a
carbohydrate on page 455, and on page 456 Test for cellulose, Test for
glycogen and Sugars from other sources. |
| · |
Replace Exercise 22
with the modified version below and omit Exercises 23 and 24. |
| · |
Omit from Lipids
(page 457) to the end of the text of the chapter on page 464.
Omit Exercises 25 to 37. |
In
Chapter 15
| · |
Omit Relative
molecular mass on page 501and Other designs of mass spectrometers on page
502.
Omit Exercise 1. |
| · |
Omit from
Ultraviolet (u.v.) spectroscopy on page 511 to the end of Atomic force
microscopy on page 521.
Omit Exercises 11 to 15. |
| · |
Add the section
below on Chromatography. |
In
Revision Tests for Option 3
In
Test A omit Questions 1 and 3 (b) and 3 (c). Allow 31 minutes for the test and
mark it out of 17.
In Test B omit Questions 1 and 2. Allow 34 minutes for the test and mark
it out of 19.
|
2.
For
teachers
The
changes to the syllabus and their consequences for Conquering Chemistry
are set out in the following table.
| Syllabus
change |
Consequence
for using CCHSC |
Section 9.9.1
In MC DP 4 change why to that
|
None |
Section 9.9.2
Delete MC DP 5
In RC DP 1 delete carbohydrates and cellulose.
In RC DP 2 delete cellulose and glycogen.
|
Omit Sugars from other sources on page 456.
Omit Test for a carbohydrate on page 455, Test for cellulose
and Test for glycogen on page 456
None (models not treated in CC but they are treated here: see below)) |
Section 9.9.3
Delete the whole section |
Omit from Lipids on page 457 to the end of the text of the chapter
on page 464.
Omit Exercises 25 to 37. |
(Old) Section
9.9.6 (now 9.9.5)
In LC change wording
In MC DP 2 replace electron spectroscopy for chemical analysis, atomic
force microscopy and scanning tunnelling microscopy with gas-liquid
chromatography and high performance liquid chromatography. |
none
Omit Sections 15.14, 15.15 and 15.16 on pages 518 to 520.
Omit exercises 14 and 15.
Include the section on Chromatography below. |
|
In RC delete DP 1 |
As
above |
| In RC DP 2 change
wording (to exclude specific mention of mass spectroscopy and its uses). |
Students need to
know the basic design of the mass spectrometer (Section 15.1), that
compounds give rise to cracking patterns (15.2) and that cracking patterns
are used by forensic scientists to identify samples (15.3). However they
can now omit the sub-section on Relative molecular mass (page 501), and
not be too concerned about Atomic masses and isotopes (page 499); Section
15.4 (page 504) can also be omitted.
Omit Exercise 1 and possibly 2, 3, 5 and 6.
|
(Old) Section
9.9.7 (now 9.9.6)
Delete MC DP 5. (u.v. and i.r. spectroscopy)
|
Omit Sections 15.12 and 15.13 on pages 511 to 517.
Omit Exercises 11, 12 and 13. |
3. Modified Exercise 22 in
Chapter 13 (page 457)
| 22. |
A
group of students had four aqueous solutions of carbohydrates to identify.
They performed the following tests on each solution:
1. add Tollen’s reagent
2. add a solution of iodine.
Results are tabulated below.
Sample S was heated with hydrochloric acid for several minutes then tested
again with Tollen’s reagent: a silvery deposit formed on the wall of the
test tube.
| Sample |
Tollen's
reagent |
Iodine
solution |
| P |
no
reaction |
blue
colour |
| Q |
silvery
deposit |
no
reaction |
| R |
silvery
deposit |
blue
colour |
| S |
no
reaction |
no
reaction |
|
a |
Which is the
only sample that could be (i) galactose (ii) sucrose (iii)
starch? Explain why. |
| b |
What test
could you perform to provide further evidence that the sample you
identified as sucrose really is sucrose? Explain. |
| c |
Which sample
could be partially hydrolysed starch? Explain why. |
|
4. Chromatography
Gas-liquid chromatography and
high performance liquid chromatography have been added to the syllabus to
replace u.v and i.r spectroscopy, electron spectroscopy for chemical analysis,
scanning tunnelling microscopy and atomic force microscopy. The following
account should provide adequate information for HSC purposes.
Introduction
|
Read Section 14.8
on pages 476-7.
The next three
sub-sections below give useful background to chromatography though they
are not strictly necessary for the HSC. |
Column
chromatography
Chromatography was first
developed by the Russian botanist, Tswett in 1903. He wanted to separate
mixtures of colouring matter he had extracted from leaves, particularly
chlorophylls. Finely divided calcium carbonate was packed into a column and the
mixture of substances in a petroleum ether solution was poured on to the top of
the column. By continuously washing the column with solvent Tswett found that
the mixture slowly passed down the column and separated into its various
coloured components.
| |
 |
|
| |
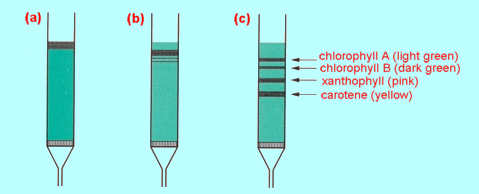
Fig 1 Column
chromatography: (a) an acetone extract of colouring matter from
leaves is added to the top of a column of alumina (shown as green), (b)
the column is washed with a suitable solvent: separation starts (c)
the different compounds are fully separated by continued washing.
|
|
Figure 1 shows a modern
version of Tswett's pioneering experiment. Washing the column continues until
the components elute (wash out) one at a time from the bottom of the
column. They can be collected in separate beakers. The separation in this form
of column chromatography is based upon different strengths of adsorption
on the solid of the substances to be separated. Passage of solutes down the
column results from repeated adsorption from, and desorption back into, the
solvent. Substances which adsorb on to the solid only weakly desorb back into
the solvent readily and therefore pass through the column rapidly. Substances
which adsorb strongly pass through the column only slowly. The solid is the
stationary phase and the liquid or solvent is the mobile phase. When the
separation is based upon adsorption, the technique is called liquid-solid
chromatography.
The name, chromatography, (literally colour
writing) arises because the technique was originally developed for the
separation of coloured substances ("chrome" means "colour").
Today as stated on page 476 of CCHSC chromatography is the separation of
substances based upon their differential distribution between two phases, one
stationary, the other mobile.
Although Tswett invented column chromatography in
1903, it did not gain widespread use until the 1930s when it was adopted by
organic chemists. This form of column chromatography is still widely used for
preparative and purification purposes.
Partition
chromatography
Between 1938 and 1941 the
Americans, Martin and Synge, developed an important variation which became known
as liquid-liquid chromatography or partition chromatography. In
this technique the stationary phase is a liquid film adsorbed on the surface of
a finely divided solid (still in a column as in Figure 1). The substances to be
separated are dissolved in a solvent (which must be immiscible with the
stationary phase) and this solution is again poured on to the top of the column
and washed down with pure solvent (the mobile phase). Separation is based upon
different solubilities of the substances in the stationary and mobile
phases. Substances which are very soluble in the mobile phase but only slightly
soluble in the stationary phase pass down the column rapidly; substances which
are very soluble in the stationary phase but only slightly soluble in the mobile
phase move through the column very slowly. In this way a separation is effected.
Martin and Synge devised the technique to
separate mixtures of amino acids (as acetates). Their stationary phase was water
adsorbed on silica gel; the mobile phase was chloroform. They received a Nobel
prize for this work in 1952.
If a suitable detector is fitted to the outlet of
the column, such as a refractive index monitor or uv absorption cell, colourless
compounds can be separated and analysed. Use of such detectors can provide
quantitative as well as qualitative analysis.
Paper
chromatography and TLC
Paper chromatography, as
described at the start of this section (i.e. on page 476 of CCHSC, is a form of
partition chromatography.
Thin layer chromatography, TLC,
is a variation of column chromatography. Here the stationary phase is a solid
spread on the surface of a glass plate or stiff sheet of aluminium foil. The
sample to be analysed is spotted on to the plate which is then stood in a
shallow pool of solvent in an enclosed container as shown in Figure 14.1 on page
477 of CCHSC. By capillary attraction the solvent creeps up the plate and elutes
the sample. Different compounds travel up the plate at different speeds.
Colourless compounds can be located by fluorescence (holding the plate under a
uv light) or by exposing the plate to a suitable colouring agent.
TLC is a cheap, quick and easy way of
qualitatively determining what compounds are present in a mixture. Spots in an
unknown are identified by comparison with spots from known compounds treated in
exactly the same way. Exercise 1 below shows how TLC can be used to identify the
compounds in mixtures of analgesics (painkillers).
It is the
next two sub-sections that are really important for the HSC.
High
performance liquid chromatography (HPLC)
A major development in
liquid-solid and liquid-liquid chromatography was the introduction of high
pressure pumps in the 1970s. These could speed up the passage of the mobile
phase through columns packed with very small solid particles (which lead to
better separations). The technique was originally called high pressure liquid
chromatography (HPLC) but the name got transformed by the commercial
marketeers into high performance liquid chromatography.
| |
 |
|
| |
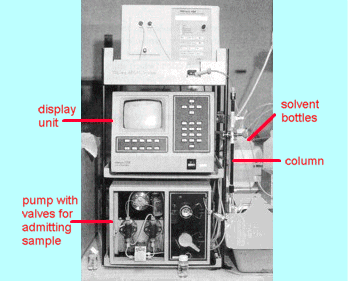
Fig 2 A typical
high performance liquid chromatograph
|
|
A typical
instrument is shown in Figure 2. The column is usually a metal tube 15 to 30 cm
long and about 3 to 10 mm internal diameter. A solution of the sample to be
analysed is admitted to the top of the column then a pump pushes solvent through
the column at high pressure to wash the components of the sample down the solid
packing (solid or liquid coated on a solid). A suitable detector such as a
refractive index monitor or an ultraviolet light absorption cell detects the
various components of the mixture as they come out the bottom of the column. It
does this by feeding its output to a computer which displays the signal as a
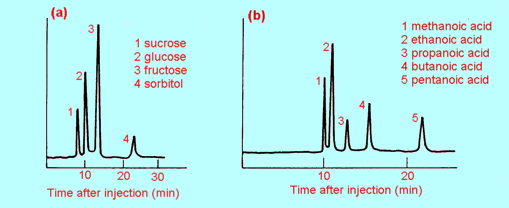
function of time after the start of the analysis. Typical HPLC traces are shown
in Figure 3. Substances are identified by the time taken to wash through the
column (called the retention time) under controlled conditions such as
temperature and solvent flow rate or by comparison with standard known samples
run under identical conditions. From the size (height or area) of the peak the
actual amount of the substance can be estimated
| |
 |
|
| |
Fig 3 Two typical HPLC
chromatograms: (a) analysis of sugars in apple juice
(b) analysis of a mixture of alkanoic acids
|
|
HPLC is a sensitive and
accurate method of identifying the compounds present in a sample (mixture) and
for determining their relative amounts. For preparative work, that is for
purifying and collecting samples, column chromatography is used (because big
columns with large amounts of stationary phase are needed to handle big
samples).
Gas
chromatography
In 1952 Martin and James
(the same Martin as above) developed another form of chromatography in which the
mobile phase was a gas. The substances to be separated (or analysed) are
vaporised into a flowing stream of a gas such as nitrogen or helium. This is
called gas chromatography of which there are two types. In gas-solid
chromatography separation is based upon selective adsorption of the compounds
from the gas phase (mobile phase) on to the solid (stationary phase). In gas-liquid
chromatography (GLC) separation is based upon different solubilities of
the compounds from the gas phase into a liquid adsorbed on a finely divided
solid (stationary phase). In the last two decades capillary GC columns have been
introduced. These consist of very fine silica capillary tubes about 0.1 to 0.5
mm in diameter, often tens of metres long, with the stationary liquid adsorbed
on the inside surface of the tube.
Gas chromatography developed very rapidly in the
decade after its first introduction, because it proved extremely useful to the
petroleum industry for analysing the complex mixtures of organic compounds which
make up crude oil and its refined products.
Gas chromatography is described briefly on page
189 of CCHSC.
In a typical gas chromatograph the sample to be
analysed is introduced by a syringe into the hot flowing carrier gas as shown in
the figure at the top of page 189 of CCHSC. The sample vaporises immediately and
the analysis proceeds by repeated transfer of the components to the stationary
phase and back to the gas again. The more strongly a substance is adsorbed or
the more soluble it is in the liquid film, the more slowly it moves through the
column. At the end of the column is a detector which signals when a component is
leaving the column (ie., passing through the detector). It also provides a
measure of the amount of the compound present. The diagram on page 189 shows a
chart recorder for displaying the chromatogram; today a computer is generally
used to show the trace and to estimate the relative amount of each
component in the mixture (from the relative areas of the peaks). As with HPLC
compounds are generally identified by the time (after injection) that they take
to reach the detector (the retention time) when conditions are carefully
controlled. This means that pure samples of all likely compounds in the mixture
must be available.
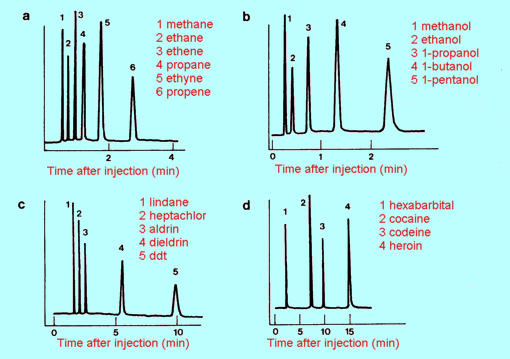
As with HPLC, GLC is a very sensitive method of
analysing mixtures both qualitatively and quantitatively. Some typical
chromatograms are shown in Figure 4.
| |
 |
|
| |
Fig 4 Gas chromatograms
of (a) simple hydrocarbons (b) simple alkanols
(c) some common insecticides (d) some commonly abused drugs
|
|
Finally
Chromatographic techniques
were originally developed to separate mixtures. The original gravity-fed columns
required quite large samples, of the order of milligrams or more. TLC and paper
chromatography could handle samples down to micrograms. Modern-day GC and HPLC
can analyse samples in the nanogram range and lower.
Hence HPLC and GLC have become major methods for
analysing trace constituents and pollutants. Typical analyses include detection
of pesticide residues in beef and other foods, illegal drugs in athletes, and
trace pollutants in air and water (aromatic hydrocarbons, CFCs, dioxins, vinyl
chloride and so on).
In summary the main chromatographic techniques
are thin layer and paper chromatography for the cheap and
rapid qualitative identification of substances, column chromatography for
separation and purification of moderately large quantities of materials, HPLC
for analysis of small quantities of non-volatile substances, gas
chromatography (GC and GLC) for analysis of small quantities of substances
which vaporise at 100 to 250° C. Another form of chromatography is ion
exchange chromatography which separates mixtures on the basis of the charge
they carry: it is widely used for analysis of amino acids.
Exercises
on chromatography
| 1. |
To
determine the substances present in a compound analgesic (painkiller) a
group of students performed a thin layer chromatography experiment. They
spotted four known pure compounds, aspirin (A), salicylamide (S), codeine
(C) and paracetamol (P) and the two unknown mixtures (X and Y) on a TLC
plate, stood it in a shallow pool of suitable solvent in a beaker (much as
in Figure 14.1(a) on page 477 of CCHSC) then allowed the solvent to creep
up the plate (by capillary attraction). When the solvent front had nearly
reached the top of the plate, they removed the plate, let it dry, then
sprayed it with iodine to make the spots visible. The plate looked as
shown below. What substances are present in the samples, X and Y?
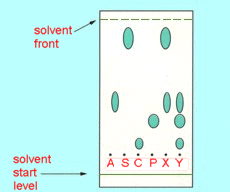
|
| 2. |
(a) |
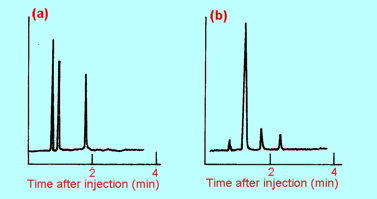
A mixture of
hydrocarbons was analysed by gas chromatography using the same conditions
as in Figure 5.11(a). The resulting chromatogram is shown in (a) below.
What substances are present in this sample?
|
|
(b) |
Gas chromatography
was used to check the purity of a sample of ethene, again using the same
conditions as in Figure 4(a). Use the chromatogram in (b) above to decide
what, if any impurities are present. Is there any unidentifiable impurity
present? Explain.
|
| 3. |
A
mixture of pesticides was analysed by gas chromatography. The conditions
used were as for Figure 4(c). The recorder trace showed a very large peak
at a time of 1.6 minutes after sample injection, and small but definite
peaks at 2.7 and 5.6 minutes. What do you conclude about the composition
of the sample? Explain fully.
|
| 4. |
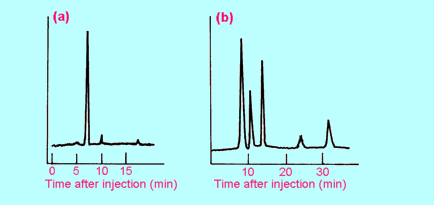
Solvent
extraction was used to extract any likely drugs of addiction from a sample
of the blood of a drug addict. The extract was then analysed by gas
chromatography under the same conditions as were used for Figure 4(d). The
result is shown at (a) below. What drug (if any) is present?
|
| 5. |
HPLC
was used to check that a sample of apple juice had not been adulterated by
the addition of some other substance(s). The resulting chromatogram, using
the conditions of Figure 3(a), is shown at (b) above. Is the apple juice
"pure"? If not, how many substances have been added to it?
Identify some or all of them (if possible). Explain your reasoning fully. |
Choosing an option
Some aspects of choosing the option to study were
discussed in the Shipwrecks and
Salvage option (click on it to go to). Those comments were made before the
Sept/Oct syllabus changes so may not be entirely appropriate now.
Options questions in the
2001 HSC
exam
(Comments
on the 2002 exam later)
Emphasis on recall of
information
Although there was a strong emphasis upon regurgitating memorised information in
the whole of the 2001 examination paper, this emphasis was strongest in the
options questions: out of the 25 marks, between 21 (Industrial chemistry) and 25
(Shipwrecks and salvage and Biochemistry of movement) marks were for recall of
information type questions. In the specimen HSC paper all 25 marks came from
factual recall questions for four options (with 16 for such questions in
Industrial chemistry). It is therefore important that students do everything in
the student activity column and prepare themselves to describe and discuss what
they did. I think it is regrettable that a chemistry exam has become a test of
students ability and/or willingness to memorise great slabs of information.
Importance of
experiments
In the 2001 paper each option question contained a significant segment on a
compulsory experiment – not just describe the experiment performed but assess
its accuracy and reliability (in three options) and discuss safety aspects (in
the other two). This is a clear indication of the continued importance that
examiners place on laboratory work; students should prepare themselves to answer
similar questions on all the compulsory experiments.
Extended
response questions
An innovation in the 2001 exam (and in the specimen paper) were questions that
carried a large number of marks (5 to 7) but which do not give specific
instructions about what was required – so-called extended response questions.
These are the hardest questions on the paper because students have to work out
what the question really wants. Fortunately the questions of this type in the
2001 paper came from the student activity column of the syllabus.
Some advice about planning and answering such
questions is given in Answers
and Comments for the 2001 HSC exam paper.
Accuracy and reliability
The meaning of these two
terms is explained in Answers
and Comments for the 2001 HSC exam paper.
Answers to the HSC exam
question
A complete working of the
2001 HSC exam question along with some advice about planning answers to the
segments of the question are given in Answers
and Comments for the 2001 HSC exam paper.
Molecular models and computer simulations
Students
are required to perform first-hand investigations using molecular model kits,
computer simulations or other multimedia resources
| · |
to
compare the structures of organic compounds including
– monosaccharides
– starch |
| · |
to present
information which describes the composition and generalised structure of
proteins. |
Some molecules for which
space-filling and ball-and-stick models can be made using a fairly basic
molecular model kit are listed below. Photographs of these models (using a
Molymod model kit) along with their structural formulae are shown in the
Molecular Model Photo Album (click on the name to open it).
| · |
glucose, galactose,
fructose
sucrose
two glucose molecules joined as in starch
two glucose molecules joined as in cellulose |
| · |
the amino acids,
glycine, alanine, cysteine
the dipeptide cysteinylalanine
the tripeptide glycylalanylcysteine |
The HSC examiners seem intent upon examining
material in the student activity (right) column of the syllabus document.
Examining this activity could present a challenge but perhaps one possibility
is:
Name and draw the structure of two compounds
relevant to the Forensic Chemistry option for which you made molecular models
or for which you carried out computer simulations or viewed other multimedia
presentations. (2 marks)
What benefits did you derive from this activity or alternatively why did you
consider this activity to be an inefficient use of valuable time? (3 marks)
The benefits of model building for moderately
complex molecules such as those listed above are (a) it gives you some idea
of what actual molecules look like, particularly how crowded together atoms can
become in big molecules (b) it allows you to see molecules in three
dimensions instead of trying to visualise them from two dimensional structures
(c) it gives you experience in relating chemical structures to the actual
appearance of molecules (d) it shows you how 'floppy' some big molecules
can become and how many different arrangements of the molecule are possible
without changing the geometry around any particular atom.
(At a later date I'll try to provide some
guidance in finding suitable computer simulations of model building on the
internet.)
(Will add more
material to this option at a later date)


